from:China Electricity Councildate:2021-12-28
From January to November 2021, the electricity consumption of the whole society increased year-on-year, and the growth rate of the electricity consumption slowed down that month. The growth rate of the electricity consumption in the country’s 20 provinces has exceeded the national average level. The electricity consumption growth rate in industry and manufacturing is lower than the average level of the whole society. The electricity consumption of the chemical industry increased positively while the electricity consumption of the building materials, ferrous and non-ferrous industries increased negatively during the month.
1. Overall electricity consumption
From January to November, the electricity consumption of the whole society reached 7,497.2TWh, increased year-on-year by 11.4%, in which monthly consumption in November was 671.8TWh, grew by 3.1% year on year.
By sectors, from January to November, the electricity consumption of the primary industry was 91.9TWh, a year-on-year increase of 18.1%; the electricity consumption of the secondary industry was 5,025.5TWh, a year-on-year increase of 10.2%. The electricity consumption of the tertiary industry was 1,300.8TWh, a year-on-year increase of 19.0% and that of residential was 1,079.0TWh, a year-on-year increase of 7.5%.
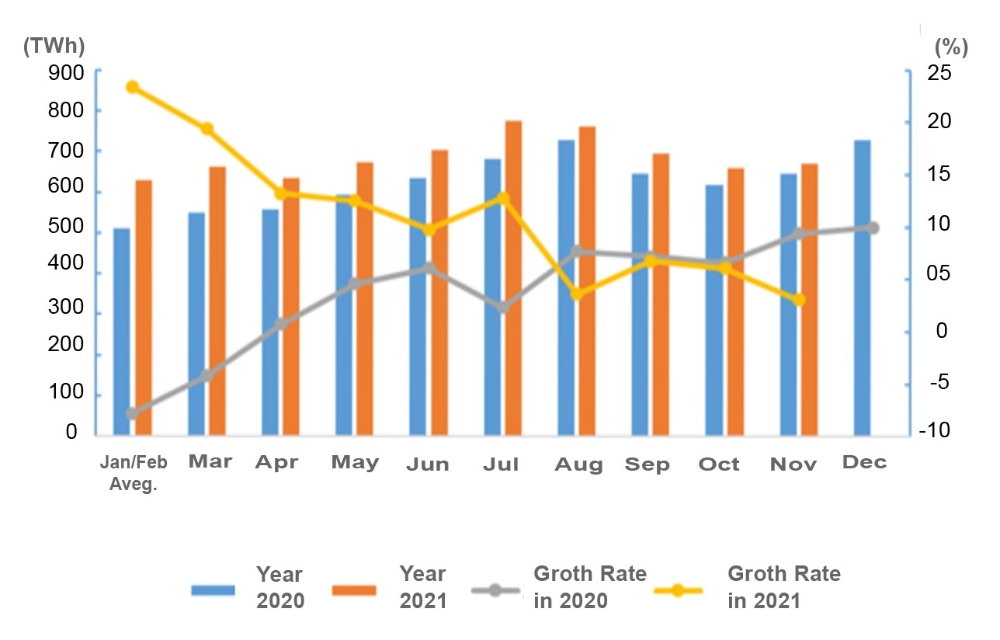
Figure 1: Electricity Consumption and Its Growth Rate by Month in 2020 and 2021
In November, the growth rates of the electricity consumption of the primary industry, the secondary industry and the tertiary industry was 14.0%, 0.8% and 8.7% respectively. The growth rate of rural residents grew by 9.5% year-on-year.
2. Electricity consumption by region
From January to November, the electricity consumption of the Eastern, Central, Western and Northeastern China was 3,591.3TWh, 1,404.8TWh, 2,093.8TWh and 407.2TWh respectively, the growth rate of each region was 11.9%, 12.8%, 10.4% and 6.7% respectively.
In November, the growth rates of the electricity consumption in Eastern, Central, Western and Northeastern China were 3.9%, 4.4%, 1.6% and 0.8% respectively.
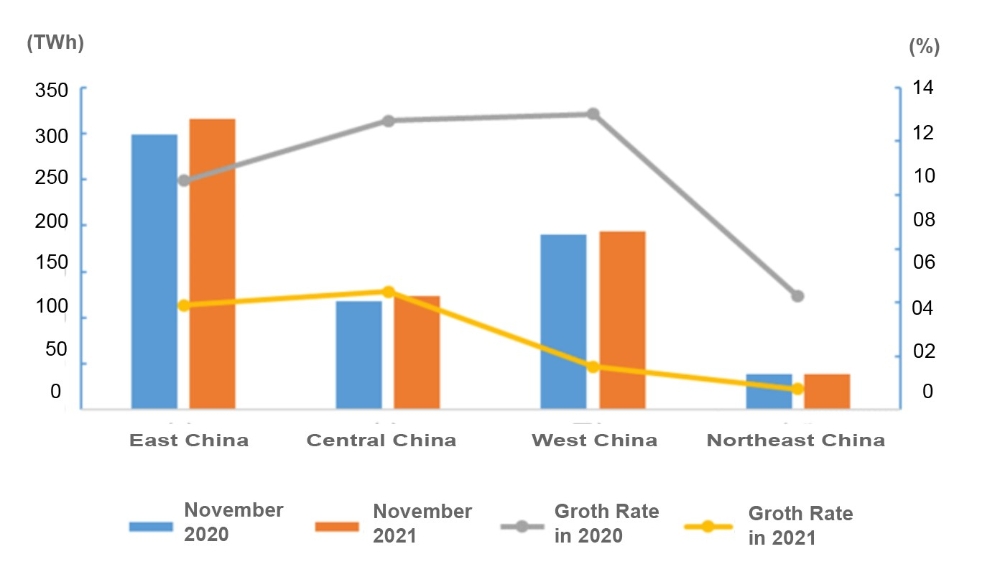
Figure 2: Electricity Consumption and its Growth Rate in November by Region
From January to November, the growth rate of the electricity consumption in country’s 20 provinces exceeded the national average level, namely: Tibet (20.9%), Hubei(17.4%), Jiangxi (16.5%), Qinghai (16.3%), Sichuan (15.5%), Zhejiang (15.4%), Fujian (15.2%), Guangdong (14.6%), Chongqing (14.5%), Anhui (13.4%), Hunan (13.2%), Shaanxi (13.0%), Jiangsu (12.9%), Ningxia (12.6%), Hainan (12.3%), Guizhou (12.3%), Guangxi (12.3%), Shanghai (12.2%), Shanxi (12.1%), and Xinjiang (12.0%).
In November alone, the growth rate of the electricity consumption in 18 provinces exceeded the national average level, namely: Tibet (14.1%), Qinghai (13.3%), Sichuan (11.8%), Hainan (11.4%), Chongqing (10.3%), Shanxi (8.6%), Beijing (8.5%), Shanghai (7.5%), Fujian (7.1%), Guizhou (6.7%), Jiangxi (5.5%), Xinjiang (4.9%), Anhui (4.9%), Zhejiang (4.4%), Hubei (4.1%), Hebei (4.0%), Jiangsu (3.9%) and Tianjin (3.5%).
3. Electricity consumption in industrial and manufacturing sector
From January to November, the industrial electricity consumption nationwide reached 4,932.0TWh, a year-on-year increase of 10.2%, 8.1 percentage points higher than the growth of the same period of last year, accounting for 65.8% of the overall electricity consumption. In November, the national industrial electricity consumption was 467.9TWh, a year-on-year increase of 0.8%, 9.2 percentage points dropped compared to last year, accounting for 69.6% of the monthly electricity consumption.
From January to November, the electricity consumption of the manufacturing industry was 3,767.0TWh, a year-on-year increase of 10.9%, 8.5 percentage points higher compared to the growth of same period of the previous year. Among them, the electricity consumption of the four energy-intensive industries totaled at 2,032.3TWh, increased by 7.4% year-on-year, with the growth rate raised by 4.1 percentage points from the same period of the previous year. The electricity consumption of the high-tech and equipment manufacturing industry was 809.8TWh, an increase of 17.0% year-on-year, 13.9 percentage points higher compared with the same period of the previous year. Electricity consumption of consumer goods manufacturing industry was 509.0TWh, an increase of 13.6% year-on-year, 16.0 percentage points higher than the previous year. Electricity consumption in other manufacturing industries was 415.8TWh, a year-on-year increase of 14.8%, grew by 12.0 percentage points compared to the previous year.
In November, the electricity consumption of the manufacturing industry was 350.9TWh, a year-on-year increase of 1.5%, dropped by 8.4 percentage points compared to the same period of the previous year. Moreover, the average daily electricity consumption of the manufacturing industry was 11.70TWh/day, increased by 0.30TWh/day compared to the same period of the previous year. Among them, electricity consumption of the four energy-intensive industries totaled at 187.2TWh, decreased by 1.8%, with its growth rate dropped by 12.5 percentage points from the same period of the previous year. The electricity consumption of the high-tech and equipment manufacturing industries was 75.7TWh, an increase of 5.9% year-on-year, 5.2 percentage points lower than the same period of the previous year. The electricity consumption of consumer goods manufacturing industry was 48.2TWh, an increase of 4.4%, with its growth rate dropped by 0.6 percentage points. The electricity consumption of other manufacturing industries was 39.8TWh, a year-on-year increase of 6.5%, which was 3.7 percentage points lower than the same period of the previous year.
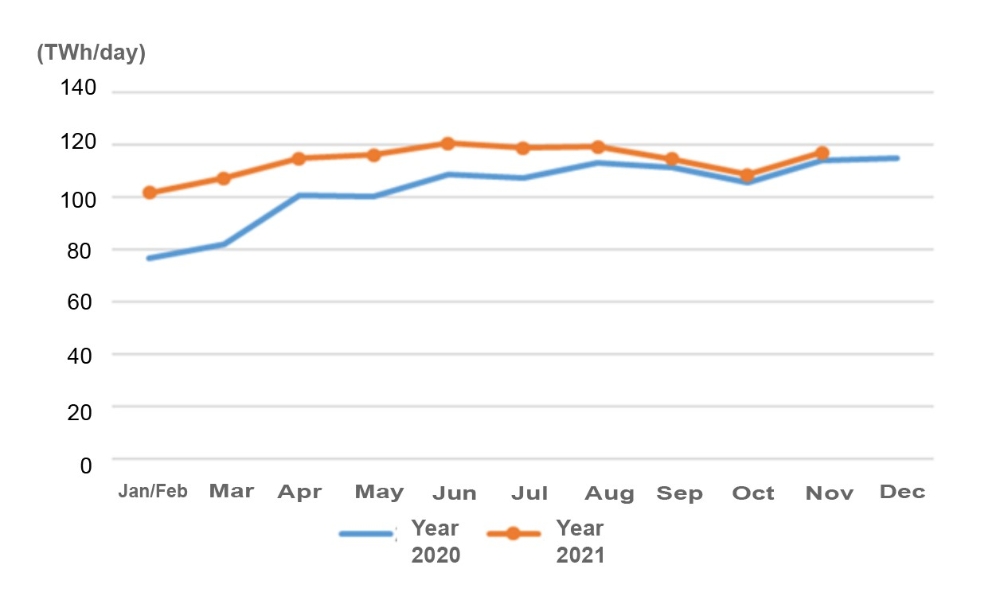
Figure 3: Average Daily Electricity Consumption of Manufacturing by Month in 2020 and 2021
4. Electricity consumption in energy-intensive industries
From January to November, the electricity consumption of the chemical industry was 458.2TWh, an increase of 7.4% year-on-year, and the growth rate raised by 6.1 percentage points from the same period of the previous year. The electricity consumption of the building materials industry was 380.4TWh, increased by 8.3% year-on-year, 4.8 percentage points higher over the same period of the previous year. The electricity consumption of the ferrous metal smelting and refining industry was 582.4TWh, an increase of 7.7% year-on-year, which was 4.2 percentage points higher than the same period of the previous year. The electricity consumption of non-ferrous metal smelting and refining industry was 611.3TWh, grew by 6.4%, and the growth rate was 2.1 percentage points higher than the same period of the previous year.
In November, the electricity consumption of the chemical industry was 42.6TWh, increased by 1.3% year-on-year, with its growth rate dropped by 9.8 percentage points compared to the same period of the previous year. The electricity consumption of the building materials industry was 36.9TWh, decreased by 5.0% year-on-year and 17.1 percentage points dropped compared to the same period of the previous year. Electricity consumption of ferrous metal smelting and refining industry was 52.1TWh, a decrease of 2.5% year-on-year, 11.5 percentage points lower than the same period of the previous year. The electricity consumption of the non-ferrous metal smelting and refining industry was 55.6TWh, a decrease of 1.2% year-on-year, dropped by 12.2 percentage points compared to last year.
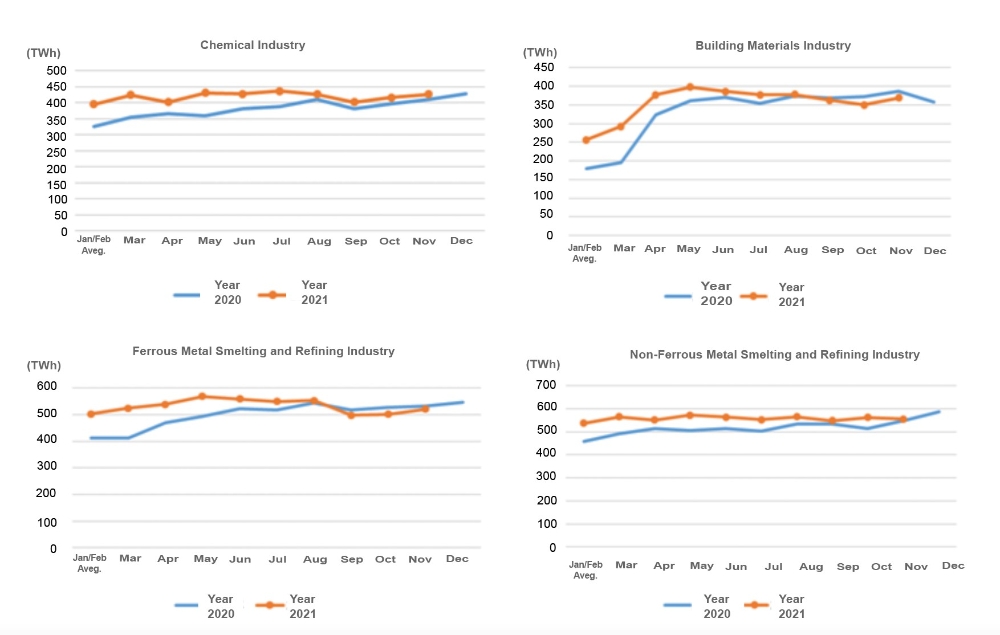
Figure 4: Monthly Electricity Consumption of Key Industries in 2020 and 2021
Tel:+86-25-84152563
Fax:+86-25-52146294
Email:export@hbtianrui.com
Address:Head Office: No.8 Chuangye Avenue, Economic Development Zone, Tianmen City, Hubei Province, China (Zip Code: 431700) Nanjing Office: Room 201-301, Building K10,15 Wanshou Road,Nanjing Area, China (Jiangsu) Pilot Free Trade Zone,Jiangsu Province,China (Zip Code:211899)