from:China Electricity Councildate:2021-11-26
From January to October 2021, the electricity consumption of the whole society grew still rapidly and the growth rate of the primary, the secondary and the tertiary industry all maintained double-digit increase. The growth rate of the electricity consumption in the country’s 20 provinces has exceeded the national average level. Among the manufacturing industries, the growth rate of high-tech and equipment manufacturing was leading. The combined electricity consumption growth rate of the four energy-intensive industries during the month was negative for two consecutive months; the building materials and ferrous industries increased negatively and the chemical and non-ferrous industries increased positively during the month.
1. Overall electricity consumption
From January to October, the electricity consumption of the whole society reached 6,825.4TWh, increased year-on-year by 12.2%, in which monthly consumption in October was 660.3TWh, grew by 6.1% year on year.
By sectors, from January to October, the electricity consumption of the primary industry was 84.1TWh, a year-on-year increase of 18.4%; the electricity consumption of the secondary industry was 4,549.0TWh, a year-on-year increase of 11.3%. The electricity consumption of the tertiary industry was 1,194.9TWh, a year-on-year increase of 20.0% and that of residential was 997.4TWh, a year-on-year increase of 7.4%.
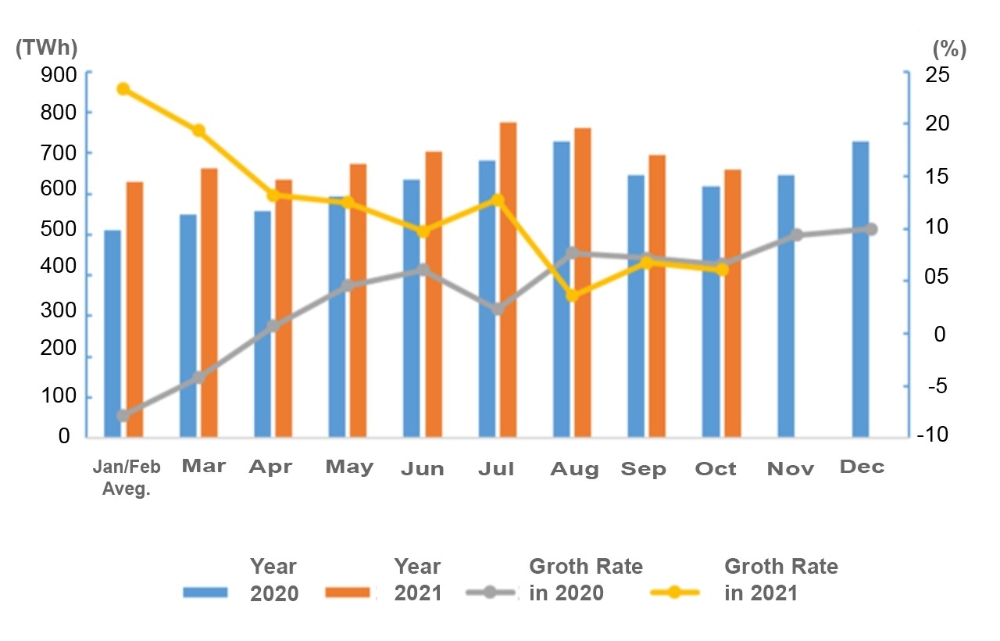
Figure 1: Electricity Consumption and Its Growth Rate by Month in 2020 and 2021
In October, the growth rates of the electricity consumption of the primary industry, the secondary industry and the tertiary industry was 14.7%, 3.2% and 14.3% respectively. The growth rate of rural residents grew by 11.1% year-on-year.
2. Electricity consumption by region
From January to October, the electricity consumption of the Eastern, Central, Western and Northeastern China was 3,275.3TWh, 1,281.7TWh, 1,900.2TWh and 368.2TWh respectively, the growth rate of each region was 12.8%, 13.7%, 11.3% and 7.4% respectively.
In October, the growth rates of the electricity consumption in Eastern, Central, Western and Northeastern China were 5.1%, 12.3%, 5.0% and 0.8% respectively.
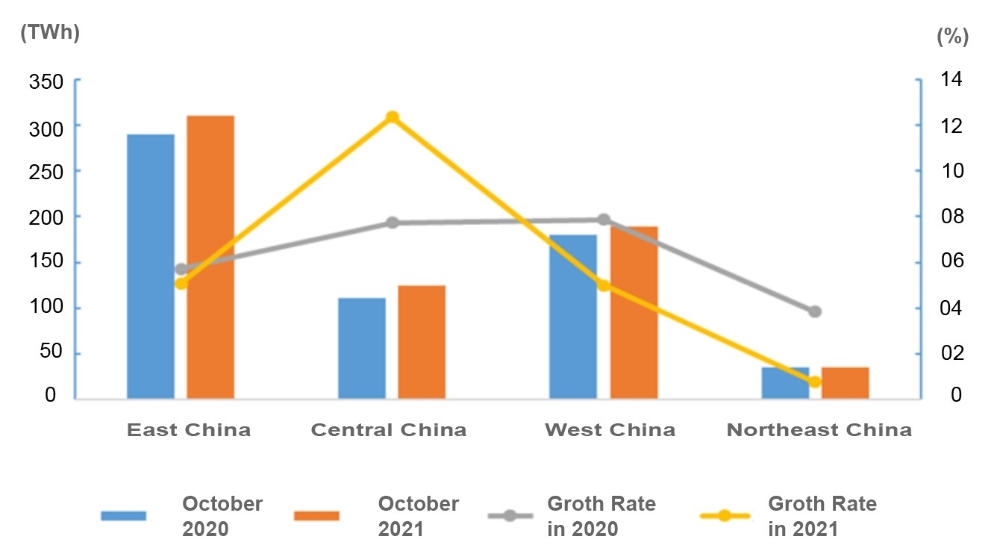
Figure 2: Electricity Consumption and its Growth Rate in Oct. by Region
From January to October, the growth rate of the electricity consumption in country’s 20 provinces exceeded the national average level, namely: Tibet (21.9%), Hubei (18.8%), Jiangxi (17.6%), Qinghai (16.7%), Zhejiang (16.5%), Fujian (16.0%), Sichuan (15.9%), Guangdong (15.8%), Shaanxi ( 15.1%), Chongqing (14.9%), Hunan (14.5%), Anhui (14.3%), Ningxia (14.1%), Guangxi (13.9%), Jiangsu (13.8%), Guizhou (12.9%), Xinjiang (12.8%) ), Shanghai (12.6%), Shanxi (12.5%) and Hainan (12.4%).
In October alone, the electricity consumption in all provinces has seen positive growth and the growth of electricity consumption in 17 provinces exceeded the national average level, namely: Hunan (24.0%), Chongqing (16.7%), Shanghai (16.4%), Hubei (15.1%), Jiangxi (14.9%), Xinjiang (14.5%), Sichuan (14.4%), Tibet (14.2%), Qinghai ( 12.4%), Hainan (12.3%), Anhui (11.9%), Guangdong (9.9%), Beijing (9.4%), Fujian (9.2%), Shanxi (9.0%), Gansu (8.6%) and Heilongjiang (6.5%).
3. Electricity consumption in industrial and manufacturing sector
From January to October, the industrial electricity consumption nationwide reached 4,464.1TWh, a year-on-year increase of 11.3%, 10.1 percentage points higher than the growth of the same period of last year, accounting for 65.4% of the overall electricity consumption. In October, the national industrial electricity consumption was 442.9TWh, a year-on-year increase of 3.1%, 4.5 percentage points dropped compared to last year, accounting for 67.1% of the monthly electricity consumption.
From January to October, the electricity consumption of the manufacturing industry was 3,415.5TWh, a year-on-year increase of 12.0%, 10.3 percentage points higher compared to the growth of same period of the previous year. Among them, the electricity consumption of the four energy-intensive industries totaled at 1,845.0TWh, increased by 8.4% year-on-year, with the growth rate raised by 5.8 percentage points from the same period of the previous year. The electricity consumption of the high-tech and equipment manufacturing industry was 733.9TWh, an increase of 18.3% year-on-year, 16.1 percentage points higher compared with the same period of the previous year. Electricity consumption of consumer goods manufacturing industry was 460.7TWh, an increase of 14.5% year-on-year, 17.7 percentage points higher than the previous year. Electricity consumption in other manufacturing industries was 376.0TWh, a year-on-year increase of 15.8%, grew by 13.5 percentage points compared to the previous year.
In October, the electricity consumption of the manufacturing industry was 336.2TWh, a year-on-year increase of 1.4%, dropped by 9.5 percentage points compared to the same period of the previous year. Moreover, the average daily electricity consumption of the manufacturing industry was 10.85TWh/day, increased by 0.29TWh/day compared to the same period of the previous year. Among them, electricity consumption of the four energy-intensive industries totaled at 182.9TWh, decreased by 1.0%, with its growth rate dropped by 12.4 percentage points from the same period of the previous year. The electricity consumption of the high-tech and equipment manufacturing industries was 70.5TWh, an increase of 6.2% year-on-year, 6.1 percentage points lower than the same period of the previous year. The electricity consumption of consumer goods manufacturing industry was 45.7TWh, an increase of 1.8%, with its growth rate dropped by 5.3 percentage points. The electricity consumption of other manufacturing industries was 37.2TWh, a year-on-year increase of 4.1%, which was 6.2 percentage points lower than the same period of the previous year.
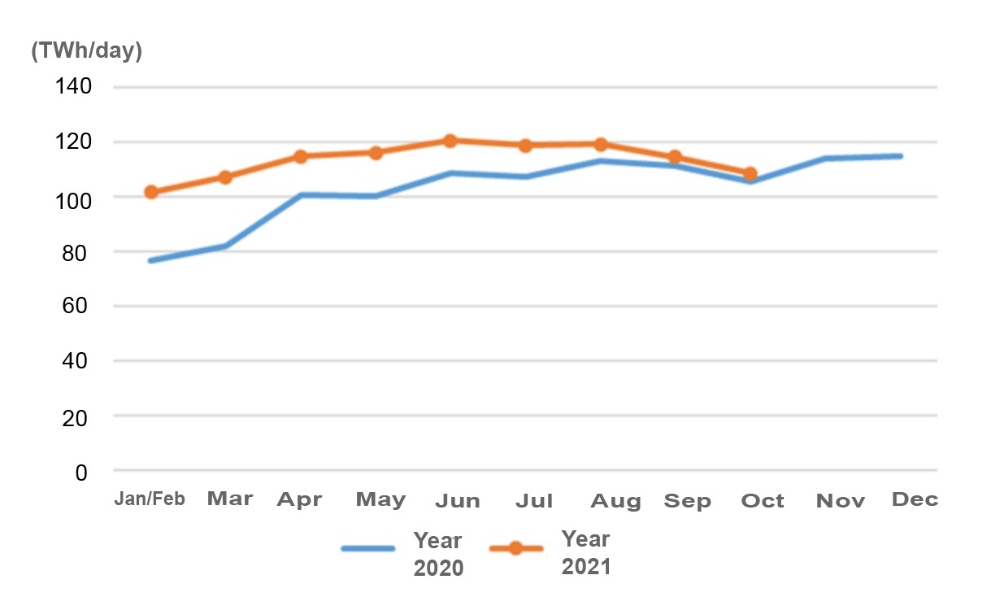
Figure 3: Average Daily Electricity Consumption of Manufacturing by Month in 2020 and 2021
4. Electricity consumption in energy-intensive industries
From January to October, the electricity consumption of the chemical industry was 415.6TWh, an increase of 8.1% year-on-year, and the growth rate raised by 7.7 percentage points from the same period of the previous year. The electricity consumption of the building materials industry was 343.4TWh, increased by 10.0% year-on-year, 7.5 percentage points higher over the same period of the previous year. The electricity consumption of the ferrous metal smelting and refining industry was 530.2TWh, an increase of 8.8% year-on-year, which was 5.6 percentage points higher than the same period of the previous year. The electricity consumption of non-ferrous metal smelting and refining industry was 555.8TWh, grew by 7.2%, and the growth rate was 3.6 percentage points higher than the same period of the previous year.
In October, the electricity consumption of the chemical industry was 41.6TWh, increased by 1.3% year-on-year, with its growth rate dropped by 8.3 percentage points compared to the same period of the previous year. The electricity consumption of the building materials industry was 35.0TWh, decreased by 7.0% year-on-year and 22.6 percentage points dropped compared to the same period of the previous year. Electricity consumption of ferrous metal smelting and refining industry was 50.2TWh, a decrease of 5.6% year-on-year, 18.1 percentage points lower than the same period of the previous year. The electricity consumption of the non-ferrous metal smelting and refining industry was 56.2TWh, an increase of 6.1% year-on-year, dropped by 2.8 percentage points.
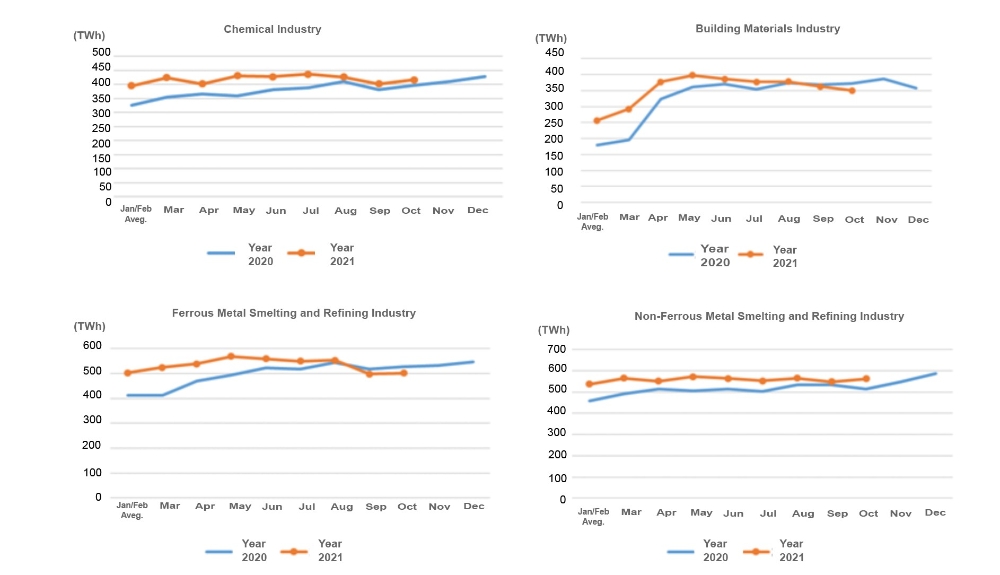
Figure 4: Monthly Electricity Consumption of Key Industries in 2020 and 2021
Tel:+86-25-84152563
Fax:+86-25-52146294
Email:export@hbtianrui.com
Address:Head Office: No.8 Chuangye Avenue, Economic Development Zone, Tianmen City, Hubei Province, China (Zip Code: 431700) Nanjing Office: Room 201-301, Building K10,15 Wanshou Road,Nanjing Area, China (Jiangsu) Pilot Free Trade Zone,Jiangsu Province,China (Zip Code:211899)