from:China Electricity Councildate:2021-09-22
From January to Aug 2021, the electricity consumption of the whole society increased year on year and the growth rate slowed down that month. The growth rate of the electricity consumption in the country’s 17 provinces has exceeded the national average level. The electricity consumption of industrial and manufacturing sectors maintained rapid growth. The growth rates of the electricity consumption in four energy-intensive industries are lower than the average level of the manufacturing industry.
1. Overall electricity consumption
From January to August, the electricity consumption of the whole society reached 5,470.4TWh, increased year-on-year by 13.8%, in which monthly consumption in August was 760.7TWh, grew by 3.6% year on year.
By sectors, from January to August, the electricity consumption of the primary industry was 66.0TWh, a year-on-year increase of 19.3%; the electricity consumption of the secondary industry was 3,652.9TWh, a year-on-year increase of 13.1%. The electricity consumption of the tertiary industry was 953.3TWh, a year-on-year increase of 21.9% and that of residential was 798.1TWh, a year-on-year increase of 7.5%.
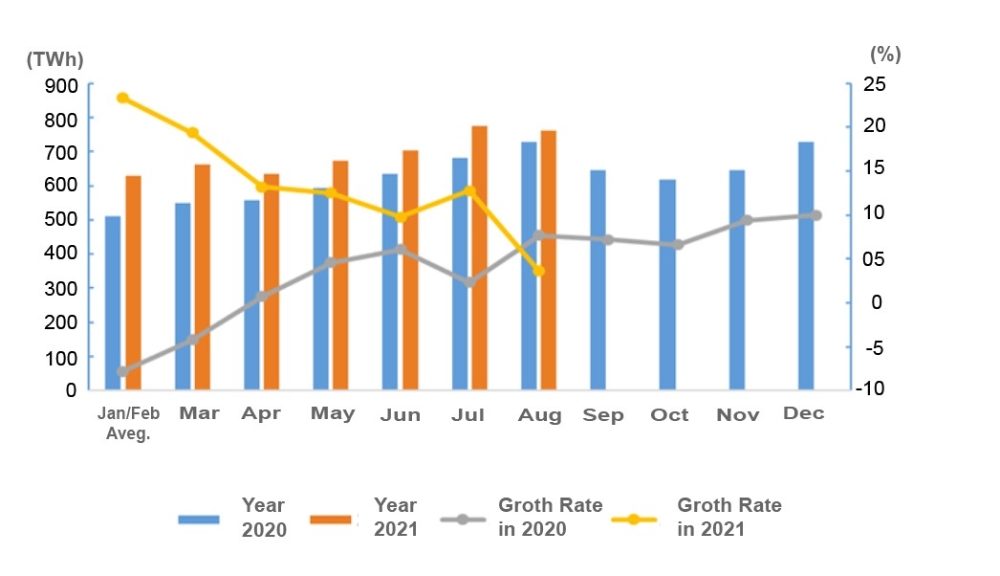
Figure 1: Electricity Consumption and Its Growth Rate by Month in 2020 and 2021
In August, the electricity consumption of the primary, secondary and tertiary industries grew by 13.7%, 0.6% and 6.2% respectively, while the residential electricity consumption increased by 12.5% year on year.
2. Electricity consumption by region
From January to August, the electricity consumption of the Eastern, Central, Western and Northeastern China was 2,622.7TWh, 1,025.0TWh, 1,524.5TWh and 298.2TWh respectively, the growth rates in four regions were 14.5%, 14.4%, 13.2% and 8.7%.
In August, the growth rates of the electricity consumption in Eastern, Central, Western and Northeastern China were 2.9%, -0.3%, 7.7% and 4.6% respectively.
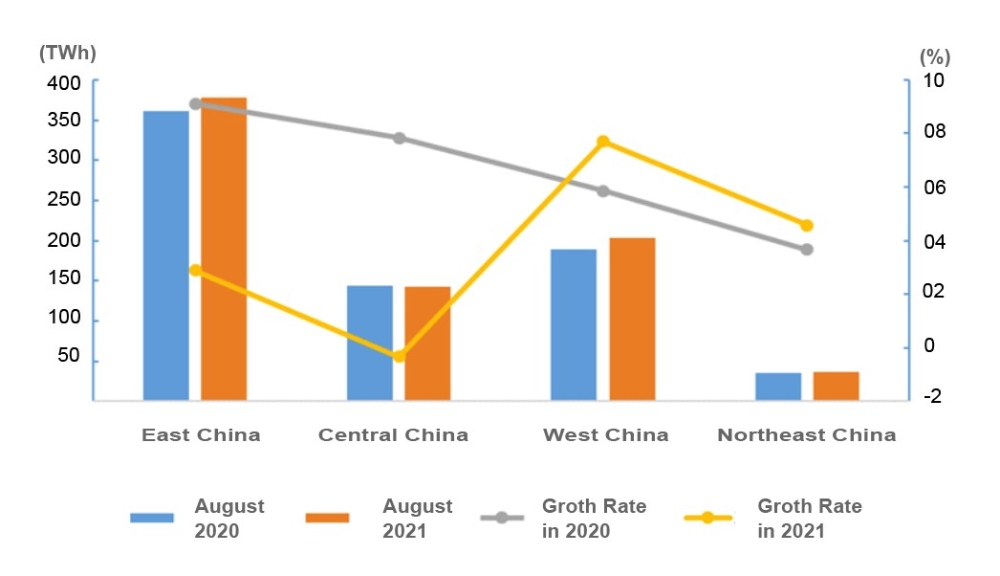
Figure 2: Electricity Consumption and its Growth Rate in Aug. by Region
From January to August, the growth rate of the electricity consumption in country’s 17 provinces exceeded the national average level, namely: Tibet (24.6%), Hubei (19.4%), Shaanxi (18.8%), Zhejiang (18.3), Sichuan (18.0%), Ningxia (17.4%), Guangdong(17.3%), Qinghai (16.9%), Jiangsu (16.7%), Jiangxi (16.7%), Fujian (16.4%), Guangxi (15.9%), Anhui (14.9%), Chongqing (14.4%), Hunan (14.2%), Guizhou (14.2%) and Shanxi (13.8%) 。
In August alone, the growth of electricity consumption in 16 provinces exceeded the national average level, namely: Xinjiang (17.1%), Sichuan (16.3%), Hainan (14.1%), Qinghai (14.1%), Guizhou (13.9%), Ningxia (13.0%), Shanxi (12.1%), Shaanxi (11.8%), Tibet (11.1%), Guangxi (8.7%), Guangdong (8.4%), Fujian (8.1%), Gansu (7.3%), Heilongjiang (6.4%), Liaoning (5.1%) and Hebei (4.1%).
3. Electricity consumption in industrial and manufacturing sector
From January to August, the industrial electricity consumption nationwide reached 3,585.2TWh, a year-on-year increase of 13.1%, 13.5 percentage points higher than the growth of the same period of last year, accounting for 65.5% of the overall electricity consumption. In August, the national industrial electricity consumption was 475.3TWh, a year-on-year increase of 0.6%, which was 9.3 percentage points lower compared to last year, accounting for 62.5% of the monthly electricity consumption.
From January to August, the electricity consumption of the manufacturing industry was 2,736.0TWh, a year-on-year increase of 14.9%, 15.3 percentage points higher compared to the growth of same period of the previous year. Among them, the electricity consumption of the four energy-intensive industries totaled at 1,480.8TWh, increased by 11.0% year-on-year, with the growth rate raised by 10.1 percentage points from the same period of the previous year. The electricity consumption of the high-tech and equipment manufacturing industry was 588.1TWh, an increase of 21.7% year-on-year, 21.9 percentage points higher compared with the same period of the previous year. Electricity consumption of consumer goods manufacturing industry was 366.9TWh, an increase of 18.3% year-on-year, 23.9 percentage points higher than the previous year. Electricity consumption in other manufacturing industries was 300.1TWh, a year-on-year increase of 18.9%, grew by 18.6 percentage points.
In August, electricity consumption of the manufacturing industry was 369.5TWh, a year-on-year increase of 4.0%, down by 5.7 percentage points compared to the same period of the previous year. Moreover, its average daily electricity consumption reached 11.92TWh, up by 6.0TWh/day over the same period of last year. Among them, electricity consumption of the four energy-intensive industries totaled at 192.4TWh, increased by 1.5%, with its growth rate dropped by 7.7 percentage points from the same period of the previous year. The electricity consumption of the high-tech and equipment manufacturing industries was 82.9TWh, an increase of 5.9% year-on-year, 7.9 percentage points lower than the same period of the previous year. Electricity consumption of consumer goods manufacturing industry was 52.7TWh, an increase of 7.3%, with its growth rate rose by 1.7 percentage points. The electricity consumption of other manufacturing industries was 41.5TWh, a year-on-year increase of 8.2%, which was 1.3 percentage points lower than the same period of the previous year.
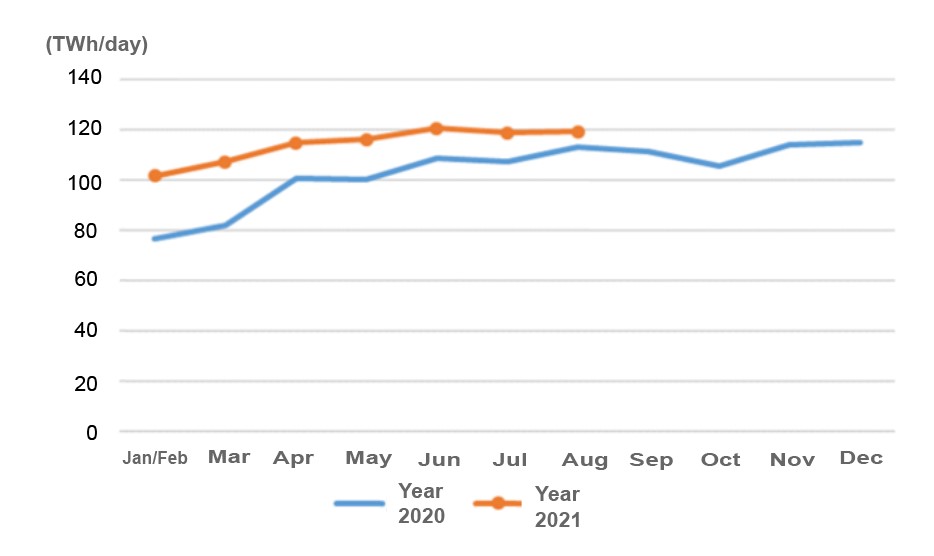
Figure 3: Average Daily Electricity Consumption of Manufacturing by Month in 2020 and 2021
4. Electricity consumption in energy-intensive industries
From January to August, the electricity consumption of the chemical industry was 333.8TWh, an increase of 9.9% year-on-year, and the growth rate raised by 11.2 percentage points from the same period of the previous year. The electricity consumption of the building materials industry was 272.1TWh, increased by 14.5% year-on-year, 14.9 percentage points higher over the same period of the previous year. The electricity consumption of the ferrous metal smelting and refining industry was 430.2TWh, an increase of 12.6% year-on-year, which was 11.3 percentage points higher than the same period of the previous year. The electricity consumption of non-ferrous metal smelting and refining industry was 444.6TWh, grew by 8.2%, and the growth rate was 5.4 percentage points higher than the same period of the previous year.
In August, the electricity consumption of the chemical industry was 42.7TWh, increased by 0.5% year-on-year, with its growth rate dropped by 9.0 percentage points compared to the same period of the previous year. The electricity consumption of the building materials industry was 37.8TWh, an increase of 0.4%, 10.8 percentage points dropped compared to the same period of the previous year. Electricity consumption of ferrous metal smelting and refining industry was 55.3TWh, an increase of 1.1% year-on-year, 7.9 percentage points lower than the same period of the previous year. The electricity consumption of the non-ferrous metal smelting and refining industry was 56.6TWh, an increase of 3.5% year-on-year, dropped by 4.4 percentage points.
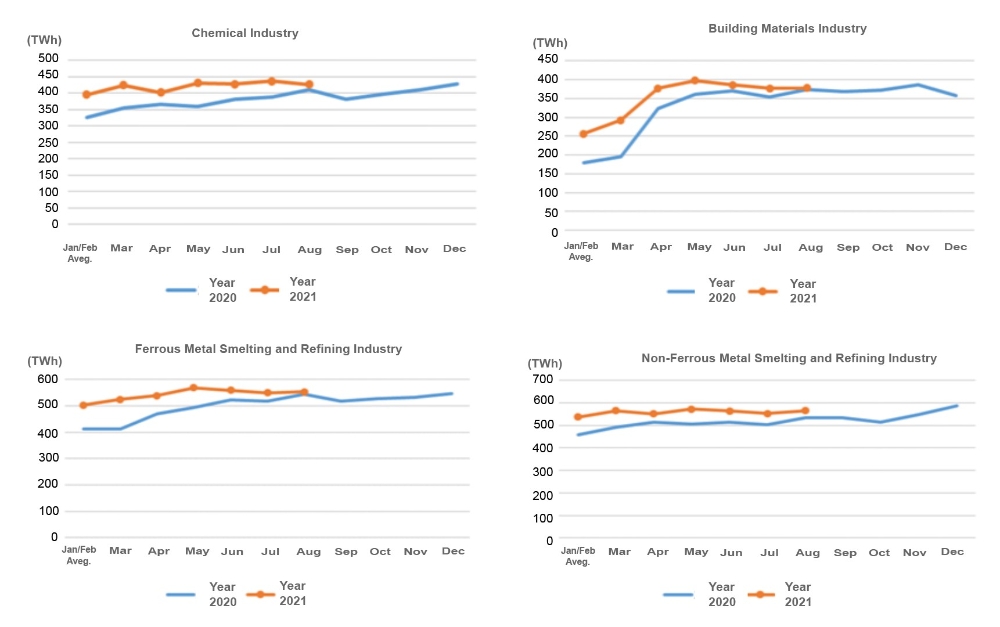
Figure 4: Monthly Electricity Consumption of Key Industries in 2020 and 2021
Tel:+86-25-84152563
Fax:+86-25-52146294
Email:export@hbtianrui.com
Address:Head Office: No.8 Chuangye Avenue, Economic Development Zone, Tianmen City, Hubei Province, China (Zip Code: 431700) Nanjing Office: Room 201-301, Building K10,15 Wanshou Road,Nanjing Area, China (Jiangsu) Pilot Free Trade Zone,Jiangsu Province,China (Zip Code:211899)