from:China Electricity Councildate:2021-08-16
From January to July 2021, the electricity consumption of the whole society continued a rapid growth and the growth rates of electricity consumption in the primary and tertiary industries are higher than the average level of the electricity consumption in the whole society. The growth rates of the electricity consumption in the country’s 16 provinces have exceeded the national average level. The growth rates of electricity consumption in equipment manufacturing, consumer goods manufacturing and other manufacturing industries are higher than the average level of the whole manufacturing industries. Except the non-ferrous industries, other energy-intensive industries have achieved double-digit growth in electricity consumption.
1. Overall electricity consumption
From January to July, the electricity consumption of the whole society reached 4,709.7TWh, increased year-on-year by 15.6%, in which monthly consumption in July was 775.8TWh, grew by 12.8%.
By sectors, from January to July, the electricity consumption of the primary industry was 55.3TWh, a year-on-year increase of 20.5%; the electricity consumption of the secondary industry was 3,167.8TWh, a year-on-year increase of 15.3%; and the electricity consumption of the tertiary industry was 813.2TWh, a year-on-year increase of 25.1%; and that of residential was 673.3TWh, a year-on-year increase of 6.6%.
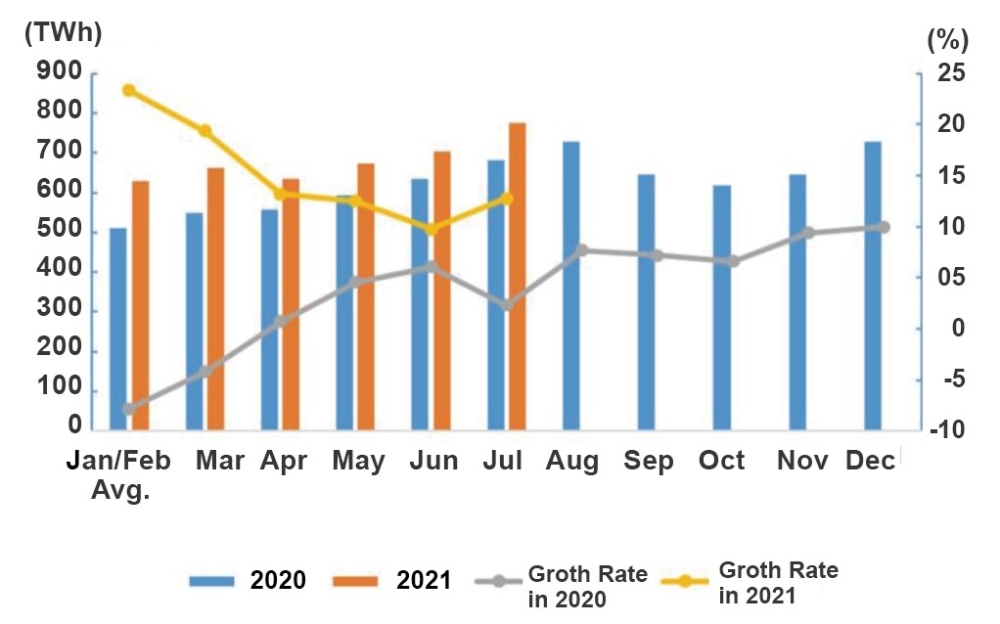
Figure 1: Electricity Consumption and Its Growth Rate by Month in 2020 and 2021
In July, the electricity consumption of the primary, secondary and tertiary industries grew by 20.0%, 9.3% and 21.6% respectively, while the residential electricity consumption increased by 18.3% year on year.
2. Electricity consumption by region
From January to July, the electricity consumption of the Eastern, Central, Western and Northeastern China was 2,245.4TWh, 882.0TWh, 1,321.0TWh and 261.3TWh respectively, the growth rates in four regions were 16.7%, 17.2%, 14.0% and 9.4%.
In July, the growth rates of the electricity consumption in Eastern, Central, Western and Northeastern China were 12.3%, 18.5%, 10.7% and 8.0% respectively.
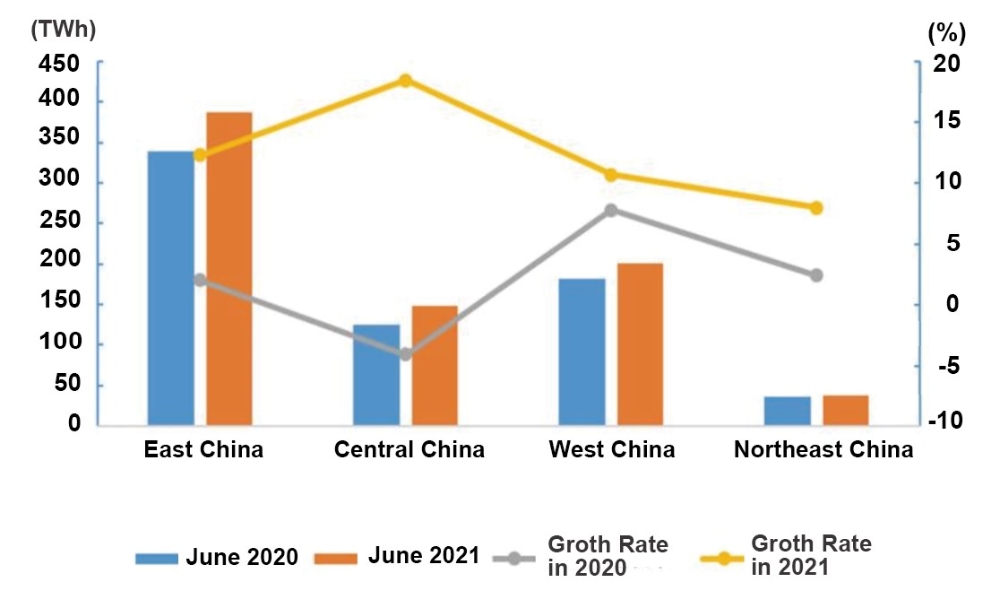
Figure 2: Electricity Consumption and its Growth Rate in July by Region
From January to July, the growth rates of the electricity consumption in country’s 16 provinces exceeded the national average level, namely: Tibet (26.7%), Hubei (24.7%), Zhejiang (21.6%), Jiangsu (20.6%), Shaanxi (20.0%), Jiangxi (19.3%), Guangdong (19.1%), Anhui (18.3%), Sichuan (18.3%), Chongqing (18.2%), Ningxia (18.1%), Fujian (18.0%), Qinghai (17.3%), Guangxi (17.2%), Hunan (16.5%) and Yunnan (16.4%).
In July alone, the growth of electricity consumption in 15 provinces exceeded the national average level, namely: Anhui (25.1%), Hubei (24.1%), Shaanxi (22.7%), Jiangsu (21.7), Chongqing (20.5%), Sichuan (19.2%), Shanghai (18.6%), Guizhou (18.6%), Zhejiang (16.3%), Jiangxi (15.3%), Qinghai (15.2%), Henan (14.1%), Ningxia (14.1%) and Beijing (12.9%).
3. Electricity consumption in industrial and manufacturing sector
From January to July, the industrial electricity consumption nationwide reached 3,109.9TWh, a year-on-year increase of 15.2%, 17.4 percentage points higher than the growth of the same period of last year, accounting for 66.0% of the overall electricity consumption. In July, the national industrial electricity consumption was 497.2TWh, a year-on-year increase of 9.2%, which was 10.1 percentage points higher compared to last year, accounting for 64.1% of the monthly electricity consumption.
From January to July, the electricity consumption of the manufacturing industry was 2,366.4TWh, a year-on-year increase of 16.8%, 18.7 percentage points higher compared to the growth of same period of the previous year. Among them, the electricity consumption of the four energy-intensive industries totaled at 1,288.4TWh, increased by 12.5% year-on-year, with the growth rate raised by 12.9 percentage points from the same period of the previous year. The electricity consumption of the high-tech and equipment manufacturing industry was 505.1TWh, an increase of 24.7% year-on-year, 27.2 percentage points higher compared with the same period of the previous year. Electricity consumption of consumer goods manufacturing industry was 314.3TWh, an increase of 20.3% year-on-year, 27.7 percentage points higher than the previous year. Electricity consumption in other manufacturing industries was 258.6TWh, a year-on-year increase of 20.8%, grew by 22.0 percentage points.
In July, electricity consumption of the manufacturing industry was 368.4TWh, a year-on-year increase of 9.4%, grew by 5.3 percentage points over the same period of the previous year. Moreover, its average daily electricity consumption reached 11.88TWh, up by 1.16TWh/day over the same period of last year. Among them, electricity consumption of the four energy-intensive industries totaled at 191.6TWh, increased by 6.5%, with its growth rate raised by 3.4 percentage points from the same period of the previous year. The electricity consumption of the high-tech and equipment manufacturing industries was 83.5TWh, an increase of 12.8% year-on-year, 6.0 percentage points higher than the same period of the previous year. Electricity consumption of consumer goods manufacturing industry was 52.0TWh, an increase of 11.8%, with its growth rate rose by 8.7 percentage points. The electricity consumption of other manufacturing industries was 41.4TWh, a year-on-year increase of 13.8%, which was 8.9 percentage points higher over the same period of the previous year.
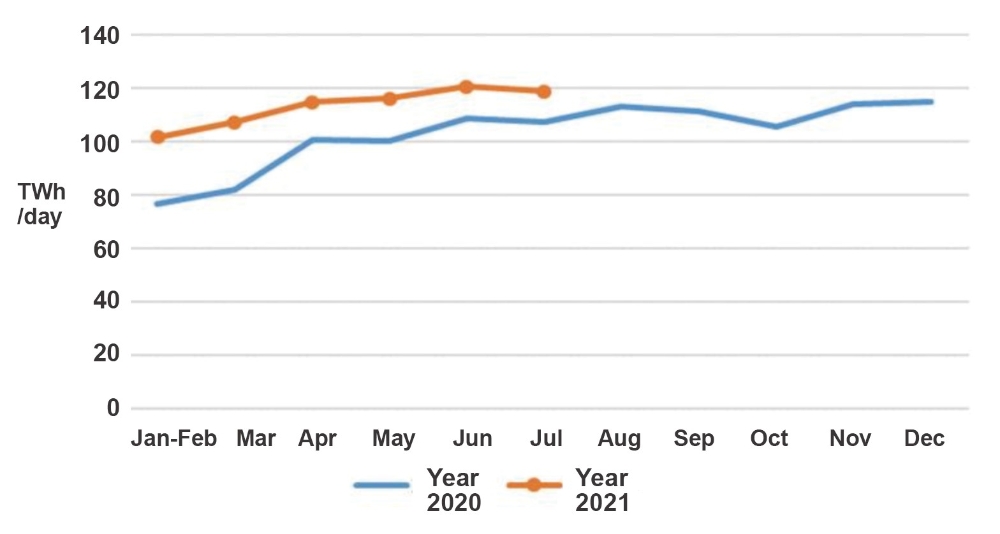
Figure 3: Average Daily Electricity Consumption of Manufacturing by Month in 2020 and 2021
4. Electricity consumption in energy-intensive industries
From January to July, the electricity consumption of the chemical industry was 291.1TWh, an increase of 11.4% year-on-year, and the growth rate raised by 14.2 percentage points from the same period of the previous year. The electricity consumption of the building materials industry was 234.3TWh, increased by 17.1% year-on-year, 19.5 percentage points higher over the same period of the previous year. The electricity consumption of the ferrous metal smelting and refining industry was 374.9TWh, an increase of 14.5% year-on-year, which was 14.2 percentage points higher than the same period of the previous year. The electricity consumption of non-ferrous metal smelting and refining industry was 388.0TWh, grew by 9.0%, and the growth rate was 6.9 percentage points higher than the same period of the previous year.
In July, the electricity consumption of the chemical industry was 43.6TWh, increased by 8.4% year-on-year, with its growth rate raised by 8.7 percentage points compared to the same period of the previous year. The electricity consumption of the building materials industry was 37.7TWh, an increase of 5.5%, 2.0 percentage points dropped compared to the same period of the previous year. Electricity consumption of ferrous metal smelting and refining industry was 55.0TWh, an increase of 6.0% year-on-year, 1.7 percentage points higher than the same period of the previous year. The electricity consumption of the non-ferrous metal smelting and refining industry was 55.3TWh, an increase of 6.2% year-on-year, grew by 4.8 percentage points.
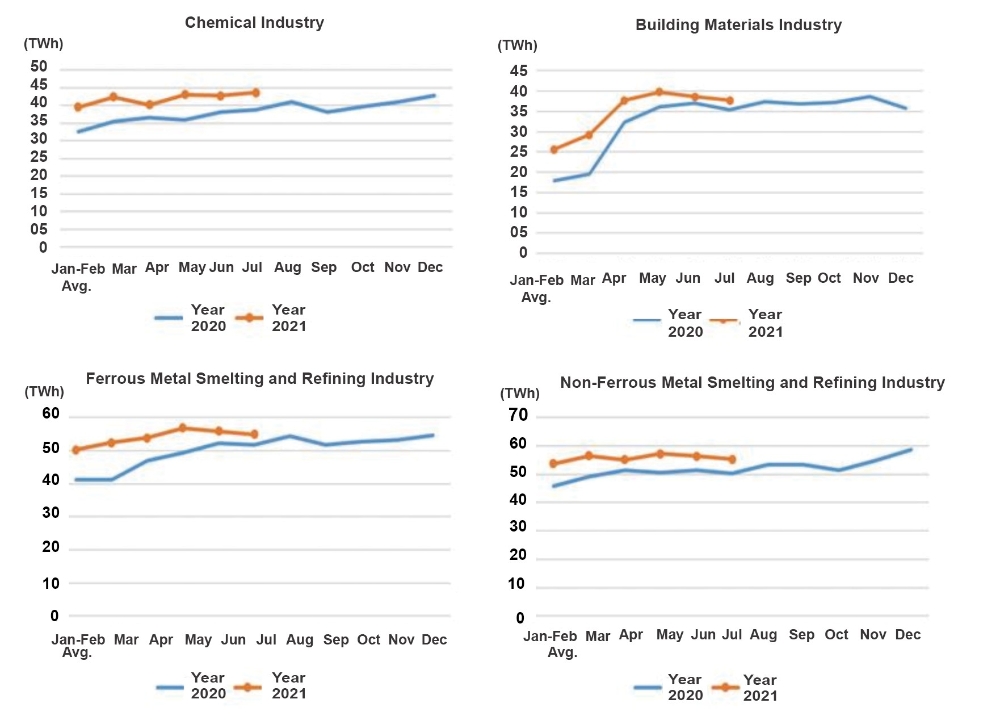
Figure 4: Monthly Electricity Consumption of Key Industries in 2020 and 2021
Tel:+86-25-84152563
Fax:+86-25-52146294
Email:export@hbtianrui.com
Address:Head Office: No.8 Chuangye Avenue, Economic Development Zone, Tianmen City, Hubei Province, China (Zip Code: 431700) Nanjing Office: Room 201-301, Building K10,15 Wanshou Road,Nanjing Area, China (Jiangsu) Pilot Free Trade Zone,Jiangsu Province,China (Zip Code:211899)