from:China Electricity Councildate:2021-08-03
From January to June 2021, the power consumption of the whole society maintained a rapid growth and the growth rate of power consumption in the three industries is higher than the average level of power consumption in the whole society. Electricity consumption growth in 15 provinces exceeded the national average. The average daily electricity consumption of the manufacturing sector hit a record high. The four energy-intensive industries maintained double-digit growth in electricity consumption.
1. Overall electricity consumption
From January to June, the overall electricity consumption reached 3,933.9TWh, increased YoY by 16.2%, in which monthly consumption in June was 703.3TWh, grew by 9.8%.
By sectors, from January to June, the electricity consumption of the primary industry was 45.1TWh, increased by 20.6%; the electricity consumption of the secondary industry was 2,661.0TWh, a YoY increase of 16.6%; and the electricity consumption of the tertiary industry was 671.0TWh, an increase of 25.8%; and that of residential was 556.8TWh, increased by 4.5%.
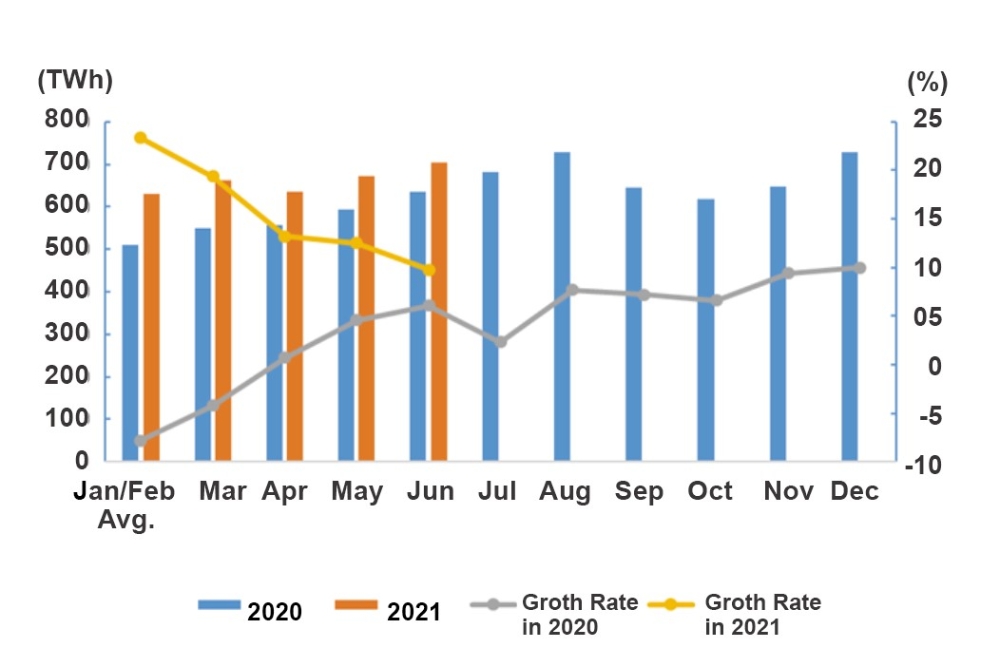
Figure 1: Electricity Consumption and Its Growth Rate by Month in 2020 and 2021
In June, the electricity consumption of primary, secondary and tertiary industries grew by 16.3%, 8.5% and 17.5% respectively, while residential electricity consumption fell by 6.8% year on year.
2. Electricity consumption by region
From January to June, the electricity consumption of the Eastern, Central, Western and Northeastern China was 1,858.1TWh, 733.9TWh, 1,119.5TWh and 222.4TWh respectively, the growth rates in four regions were 17.7%, 16.9%, 14.8% and 9.6%.
In June, the growth rates of the electricity consumption in Eastern, Central, Western and Northeastern China were 8.1%, 14.0%, 10.4% and 9.0% respectively.
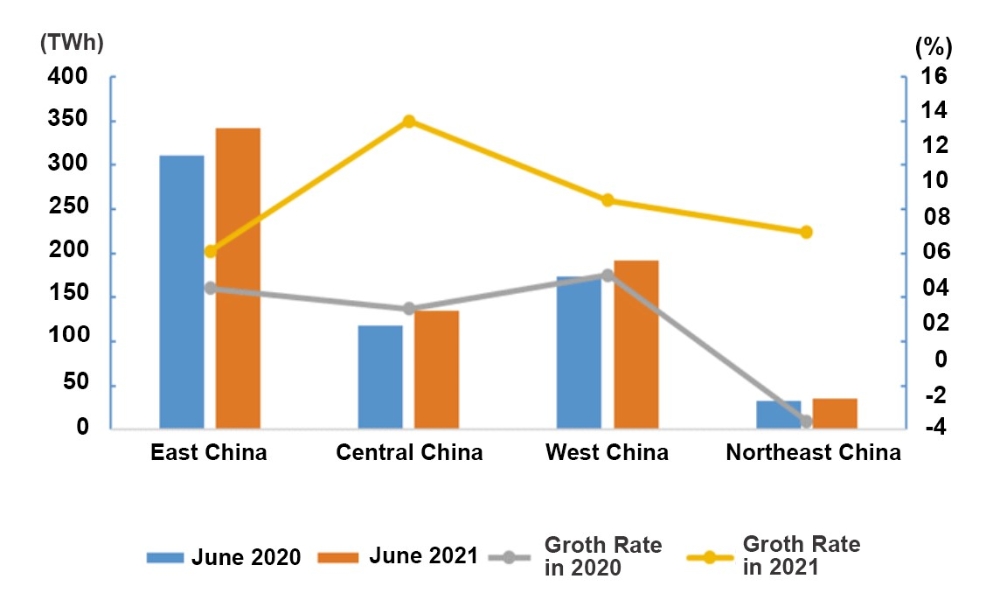
Figure 2: Electricity Consumption and its Growth Rate in June by Region
From January to June, the growth of electricity consumption in 15 provinces exceeded the national average level, namely: Tiebt (29.1%), Hubei (24.9%), Guangdong (22.9%), Zhejiang (22.9%), Yunnan (20.8%), Jiangsu (20.3%), Jiangxi (20.3%), Fujian (19.6%), Shaanxi (19.5%), Ningxia (18.9%), Guangxi (18.4%), Sichuan (18.1%), Chongqing (17.7%), Qinghai (17.7%)and Anhui (17.0%).
In June alone, the electricity consumption in all provinces has seen positive growth and the year-on-year growth of electricity consumption in 16 provinces exceeded the national average, namely: Shaanxi (23.1%), Ningxia (21.5%), Hubei (16.3%), Anhui (15.9%), Chongqing (15.0%), Jiangsu (14.6%), Guangxi (14.4%), Henan (14.2%), Hunan (13.8%), Jiangxi (13.8%), Qinghai (12.6%), Xizang (12.4%), Heilongjiang (12.1%), Sichuan (10.6%), Guizhou (10.6%) and Gansu (10.4%).
3. Electricity consumption in industrial and manufacturing sector
From January to June, the industrial electricity consumption nationwide reached 2,612.7TWh, a year-on-year increase of 16.5%, 18.9 percentage points higher than the growth of the same period of last year, accounting for 66.4% of the overall electricity consumption. In June, the national industrial electricity consumption was 474.7TWh, a year-on-year increase of 8.5%, which was 4.3 percentage points higher compared to last year, accounting for 67.5% of the monthly electricity consumption.
From January to June, the electricity consumption of the manufacturing industry was 1,998.0TWh, a year-on-year increase of 18.4%, 21.4 percentage points higher compared to the growth of same period of the previous year. Among them, the electricity consumption of the four energy-intensive industries totaled at 1,096.8TWh, increased by 13.7% year-on-year, with the growth rate raised by 14.8 percentage points from the same period of the previous year. The electricity consumption of the high-tech and equipment manufacturing industry was 421.6TWh, an increase of 27.3% year-on-year, 31.8 percentage points higher compared with the same period of the previous year. Electricity consumption of consumer goods manufacturing industry was 262.3TWh, an increase of 22.2% year-on-year, 31.6 percentage points higher than the previous year. Electricity consumption in other manufacturing industries was 217.3TWh, a year-on-year increase of 22.3%, grew by 24.7 percentage points.
In June, electricity consumption of the manufacturing industry was 361.5TWh, a year-on-year increase of 9.6%, grew by 4.9 percentage points over the same period of the previous year. Moreover, its average daily electricity consumption reached 12.05TWh, up by 1.19TWh/day over the same period of last year. Among them, electricity consumption of the four energy-intensive industries totaled at 193.7TWh, increased by 6.5%, with its growth rate raised by 2.5 percentage points from the same period of the previous year. The electricity consumption of the high-tech and equipment manufacturing industries was 78.7TWh, an increase of 13.3% year-on-year, 4.9 percentage points higher than the same period of the previous year. Electricity consumption of consumer goods manufacturing industry was 49.3TWh, an increase of 12.7%, with its growth rate rose by 10.8 percentage points. The electricity consumption of other manufacturing industries was 39.8TWh, a year-on-year increase of 15.0%, which was 9.7 percentage points higher over the same period of the previous year.
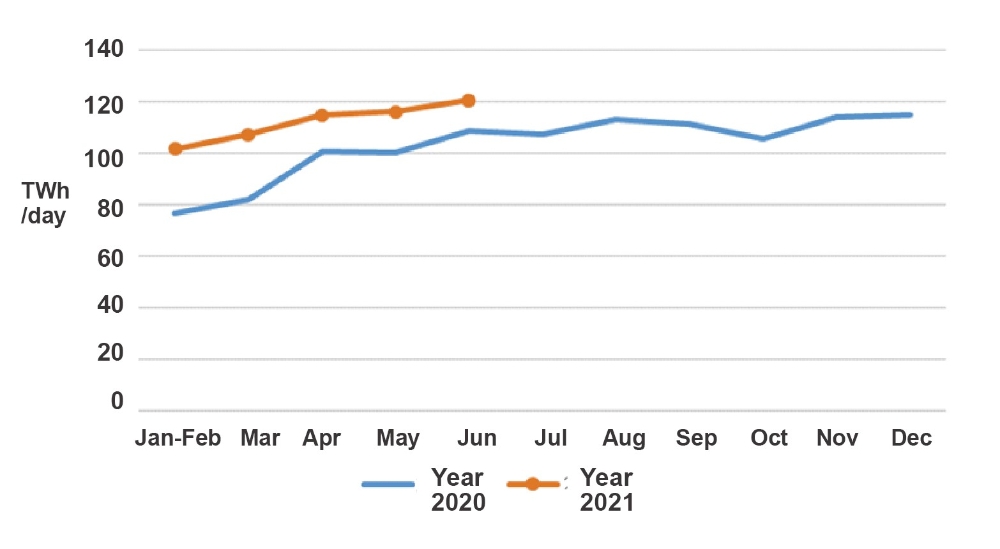
Figure 3: Average Daily Electricity Consumption of Manufacturing by Month in 2020 and 2021
4. Electricity consumption in energy-intensive industries
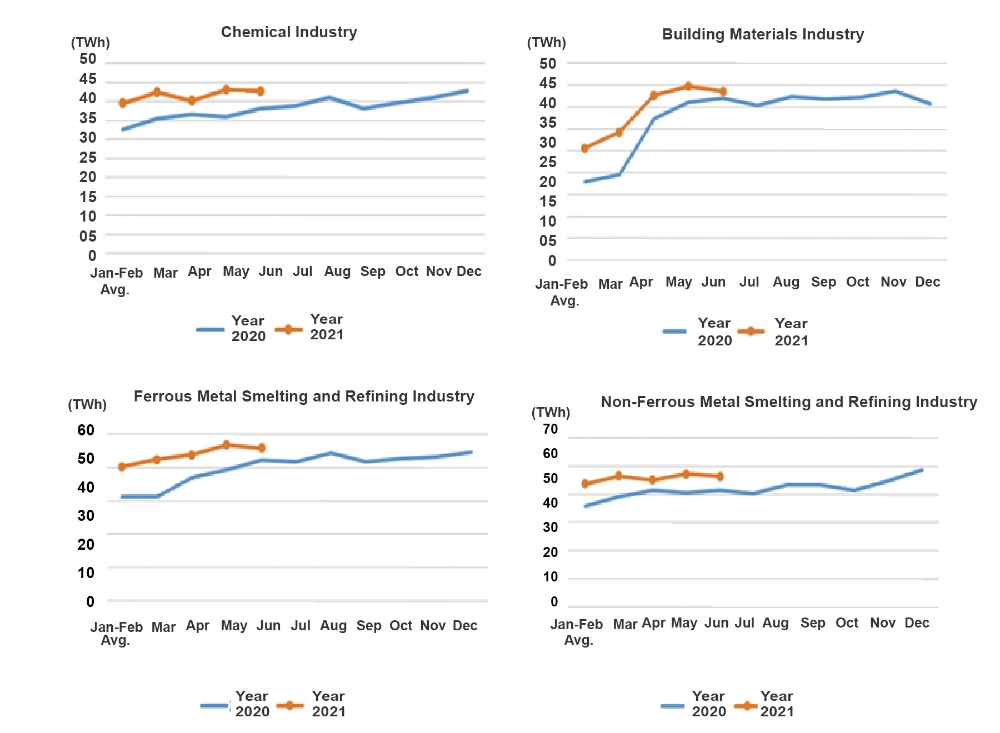
From January to June, the electricity consumption of the chemical industry was 247.5TWh, an increase of 12.0% year-on-year, and the growth rate raised by 15.2 percentage points from the same period of the previous year. The electricity consumption of the building materials industry was 196.7TWh, increased by 19.8% year-on-year, 24.2 percentage points higher over the same period of the previous year. The electricity consumption of the ferrous metal smelting and refining industry was 319.9TWh, an increase of 16.1% year-on-year, which was 16.5 percentage points higher than the same period of the previous year. The electricity consumption of non-ferrous metal smelting and refining industry was 332.7TWh, grew by 9.6%, and the growth rate was 7.5 percentage points higher than the same period of the previous year.
In June, the electricity consumption of the chemical industry was 42.8TWh, increased by 8.5% year-on-year, with its growth rate raised by 6.7 percentage points compared to the same period of the previous year. The electricity consumption of the building materials industry was 38.6TWh, an increase of 3.9%, 4.1 percentage points dropped compared to the same period of the previous year. Electricity consumption of ferrous metal smelting and refining industry was 55.9TWh, an increase of 6.6% year-on-year, 2.6 percentage points higher than the same period of the previous year. The electricity consumption of the non-ferrous metal smelting and refining industry was 56.4TWh, an increase of 6.6% year-on-year, grew by 4.0 percentage points.
Tel:+86-25-84152563
Fax:+86-25-52146294
Email:export@hbtianrui.com
Address:Head Office: No.8 Chuangye Avenue, Economic Development Zone, Tianmen City, Hubei Province, China (Zip Code: 431700) Nanjing Office: Room 201-301, Building K10,15 Wanshou Road,Nanjing Area, China (Jiangsu) Pilot Free Trade Zone,Jiangsu Province,China (Zip Code:211899)