from:China Electricity Councildate:2021-04-22
From January to March 2021, the overall electricity consumption and the electricity consumption of three industries increased rapidly year-on-year. Electricity consumption growth in 13 provinces exceeded the national average. The YoY growth of electricity consumption in industrial and manufacturing sectors are both higher than the overall electricity consumption growth. The four energy-intensive industries see double-digit growth in electricity consumption.
1. Overall electricity consumption
From January to March, the overall electricity consumption reached 1,921.9TWh, increased YoY by 21.2%, in which monthly consumption in March was 663.1TWh, grew by 19.4%.
By sectors, from January to March, the electricity consumption of the primary industry was 21.0TWh, increased by 26.4%; the electricity consumption of the secondary industry was 1,262.5TWh, a YoY increase of 24.1%; and the electricity consumption of the tertiary industry was 333.1TWh, an increase of 28.2%; and that of residential was 305.3TWh, increased by 4.7%.
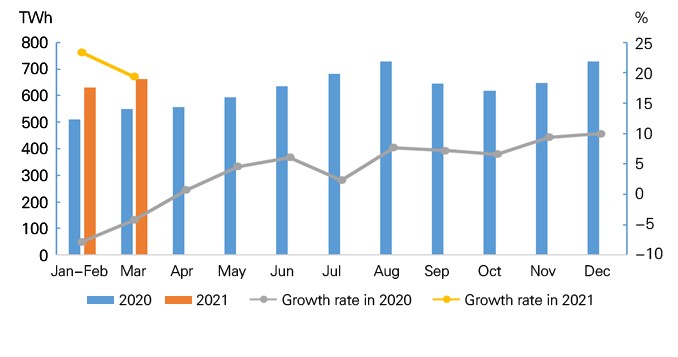
Figure 1 Electricity consumption and its growth rate by month in 2020 and 2021
In March, the electricity consumption of primary, secondary and tertiary industries grew by 26.5%, 21.2% and 42.9% respectively, while residential electricity consumption fell by 5.3% year on year.
2. Electricity consumption by region
From January to March, the electricity consumption of the Eastern, Central, Western and Northeastern China was 882.9TWh, 363.8TWh, 559.5TWh and 115.7TWh respectively, grew year-on-year by 24.5%, 22.3%, 18.1% and 10.4% respectively.
In March, the electricity consumption of the Eastern, Central, Western and Northeastern China grew by 20.4%, 25.3%, 15.8% and 11.2% respectively.
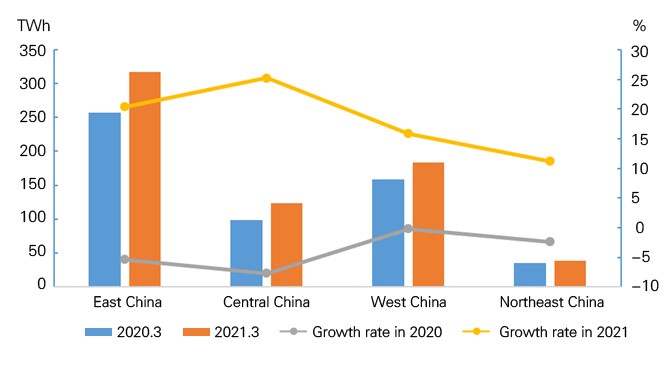
Figure 2 Electricity consumption and its growth rate in FebruaryMarch by region
From January to March, electricity consumption growth in 13 provinces exceeded the national average level, namely: Hubei (36.3%), XizangTiebt (35.9%), Zhejiang (34.8%), Guangdong (32.1%), Yunnan (30.2%), Jiangxi (28.4%), Jiangsu (27.4%), Fujian (26.2%), Guangxi (24.5%), Chongqing (23.8%), Sichuan (23.7%), Anhui (22.4%)and Shaanxi(21.3%).
In March alone, the year-on-year growth of electricity consumption in 14 provinces exceeded the national average, namely: Hubei (59.3%), XizangTibet (33.9%), Guangxi (28.7%), Jiangxi (27.2%), Yunnan (24.6%), Hunan (24.1%), Fujian (24.0%), Guangdong (23.5%), Zhejiang (22.4%), Hebei (22.1%) , Anhui (21.6%), Jiangsu (21.4%), Gansu (20.9%)and XiSichuan (19.7%). Electricity consumption in all provinces has seen positive growth.
3. Electricity consumption in industrial and manufacturing sector
From January to March, the industrial electricity consumption nationwide reached 1,238.8TWh, a year-on-year increase of 23.9%, 32.6 percentage points higher than the growth of the same period of last year, accounting for 64.5% of the overall electricity consumption. In March, the national industrial electricity consumption was 454.7TWh, a year-on-year increase of 20.8%, which was 23.6 percentage points higher compared to last year, accounting for 68.6% of the monthly electricity consumption.
From January to March, the electricity consumption of the manufacturing industry was 932.1TWh, a year-on-year increase of 26.6%, 35.7 percentage points higher compared to the growth of same period of the previous year. Among them, the electricity consumption of the four energy-intensive industries totaled at 518.8TWh, increased by 18.9% year-on-year, with the growth rate raised by 23.8 percentage points from the same period of the previous year. The electricity consumption of the high-tech and equipment manufacturing industry was 193.4TWh, an increase of 44.0% year-on-year, 58.8 percentage points higher compared with the same period of the previous year. Electricity consumption of consumer goods manufacturing industry was 118.9TWh, an increase of 34.7% year-on-year, 53.2 percentage points higher than the previous year. Electricity consumption in other manufacturing industries was 101.0TWh, a year-on-year increase of 30.7%, grew by 39.6 percentage points.
In March, electricity consumption of the manufacturing industry was 332.3TWh, a year-on-year increase of 26.4%, grew by 33.2 percentage points over the same period of the previous year. Moreover, its average daily electricity consumption reached 10.72TWh/day, up by 2.54TWh/day over the same period of last year. Among them, electricity consumption of the four energy-intensive industries totaled at 180.5TWh, increased by 20.1%, with its growth rate raised by 23.7 percentage points from the same period of the previous year. The electricity consumption of the high-tech and equipment manufacturing industries was 71.0TWh, an increase of 39.4% year-on-year, 50.0 percentage points higher than the same period of the previous year. Electricity consumption of consumer goods manufacturing industry was 44.1TWh, an increase of 30.3%, with its growth rate rose by 43.9 percentage points. The electricity consumption of other manufacturing industries was 36.7TWh, a year-on-year increase of 32.0%, which was 39.7 percentage points higher over the same period of the previous year.
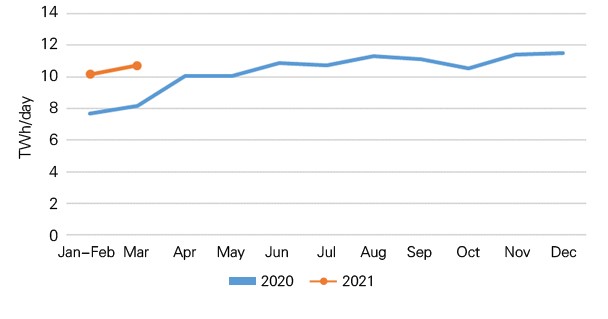
Figure 3 Average daily electricity consumption of manufacturing by month in 2020 and 2021
4. Electricity consumption in energy-intensive industries
From January to March, the electricity consumption of the chemical industry was 121.4TWh, an increase of 14.0% year-on-year, and the growth rate raised by 19.8 percentage points from the same period of the previous year. The electricity consumption of the building materials industry was 80.5TWh, increased by 40.9% year-on-year, 59.8 percentage points higher over the same period of the previous year. The electricity consumption of the ferrous metal smelting and refining industry was 153.0TWh, an increase of 20.9% year-on-year, which was 24.1 percentage points higher than the same period of the previous year. The electricity consumption of non-ferrous metal smelting and refining industry was 163.9TWh, grew by 12.1%, and the growth rate was 11.2 percentage points higher than the same period of the previous year.
In March, the electricity consumption of the chemical industry was 42.4TWh, increased by 13.6% year-on-year, with its growth rate raised by 15.6 percentage points compared to the same period of the previous year. The electricity consumption of the building materials industry was 29.2TWh, an increase of 40.9%, increased by 58.8 percentage points over the same period of the previous year. Electricity consumption of ferrous metal smelting and refining industry was 52.4TWh, an increase of 26.2% year-on-year, 32.1 percentage points higher than the same period of the previous year. The electricity consumption of the non-ferrous metal smelting and refining industry was 56.5TWh, an increase of 11.4% year-on-year, grew by 6.8 percentage points.
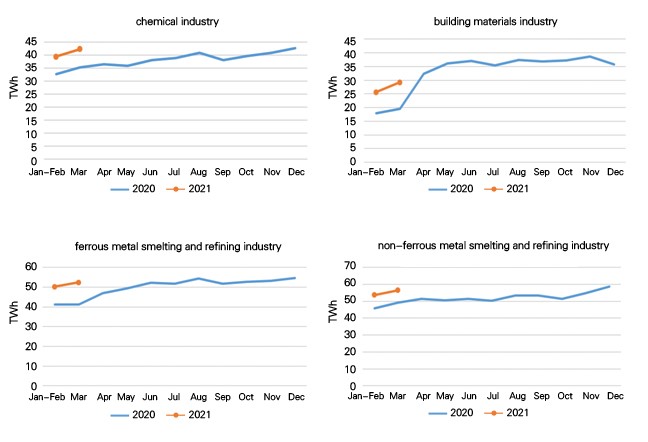
Figure 4 Monthly electricity consumption of key industries in 2020 and 2021
Tel:+86-25-84152563
Fax:+86-25-52146294
Email:export@hbtianrui.com
Address:Head Office: No.8 Chuangye Avenue, Economic Development Zone, Tianmen City, Hubei Province, China (Zip Code: 431700) Nanjing Office: Room 201-301, Building K10,15 Wanshou Road,Nanjing Area, China (Jiangsu) Pilot Free Trade Zone,Jiangsu Province,China (Zip Code:211899)