from:China Electricity Councildate:2021-03-19
From January to February, the electricity consumption of the whole society increased rapidly year-on-year, with electricity consumption in the three industries increased by more than 20% in all cases. The year-on-year growth of the electricity consumption in 14 provinces exceeded the national average. The year-on-year growth of industry and manufacturing are both higher than national average of electricity consumption. The four energy-intensive industries have a significant growth in electricity consumption.
1. Electricity consumption of the whole society
From January to February, the nationwide electricity consumption was 1258.8TWh, an increase of 22.2% year-on-year.
By sectors, from January to February, the electricity consumption of the primary industry was 14.2 TWh, an increase of 26.5% year-on-year; the electricity consumption of the secondary industry was 801.2 TWh, a year-on-year increase of 25.8%; and the electricity consumption of the tertiary industry was 231.3 TWh, a year-on-year increase of 22.5%; and that of residential was 212.1 TWh, with a year-on-year increase of 10.0%.
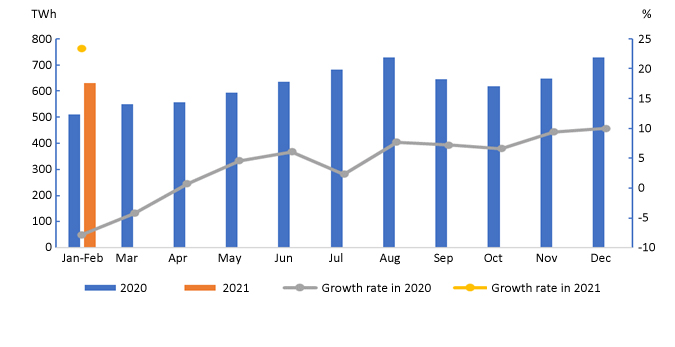
Figure 1 Electricity consumption and its growth rate by months in 2020 and 2021
2. Electricity consumption by regions
From January to February, the electricity consumption of the Eastern, Central, Western and Northeastern China was 565.7 TWh, 240.7 TWh, 375.4 TWh and 77.0 TWh respectively, with year-on-year growth rates of 27.0%, 20.8%, 19.2% and 10.0% respectively.
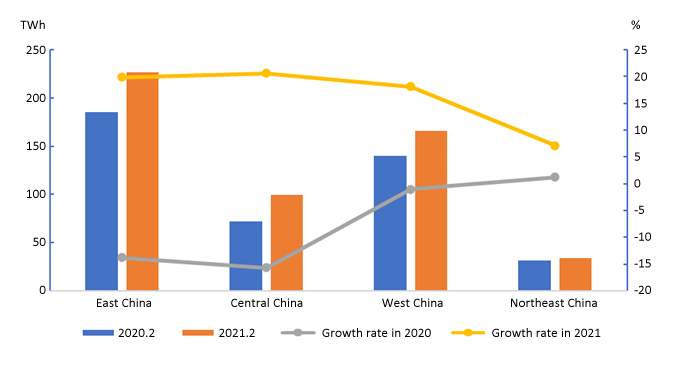
Figure 2 Electricity consumption and its growth rate in February by regions
From January to February, the year-on-year growth of electricity consumption in 14 provinces exceeded the national average, namely, Zhejiang (43.7%), Guangdong (38.2%), Tibet (36.8%), Yunnan (33.3%), Jiangsu (30.9%), Jiangxi (29.0%), Chongqing (28.5%), Fujian (27.5%), Hubei (26.7%), Sichuan (25.6%) , Guizhou (23.2%), Shaanxi (23.0%), Anhui (22.7%)and Guangxi (22.4%).
3. Electricity consumption in industry and manufacturing
From January to February, the national industrial electricity consumption was 784.3 TWh, a year-on-year increase of 25.7%, and the growth rate rose by 37.1 percentage points over the same period of the previous year, accounting for 62.3% of the total electricity consumption.
From January to February, the electricity consumption of the manufacturing industry was 599.7 TWh, a year-on-year increase of 26.7%, and the growth rate rose by 37.2 percentage points over the same period of the previous year. Among them, the electricity consumption of the four energy-intensive industries totaled 338.3 TWh, an increase of 18.3% year-on-year, and the growth rate raised by 24.2 percentage points from the same period of the previous year. The electricity consumption of the high-tech and equipment manufacturing industry was 122.3 TWh, an increase of 46.7% year-on-year, and the growth rate rose by 64.0 percentage points from the same period of the previous year. The electricity consumption of consumer goods manufacturing industry was 74.8TWh, an increase of 37.3% year-on-year, and the growth rate rose by 58.1 percentage points from the same period of the previous year. The electricity consumption of other manufacturing industries was 64.3 TWh, a year-on-year increase of 30.0%, and the growth rate increased by 40.2 percentage points over the same period of the previous year.
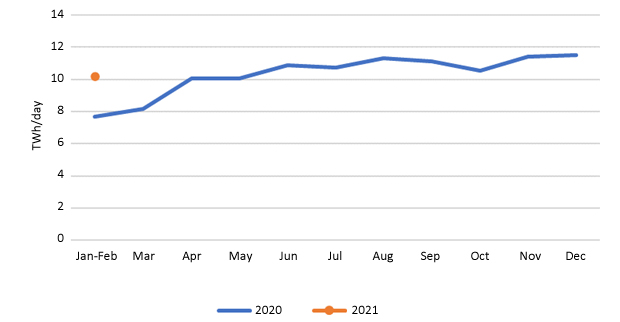
Figure 3 Daily electricity consumption of manufacturing by months in 2020 and 2021
4. Electricity consumption in energy-intensive industries
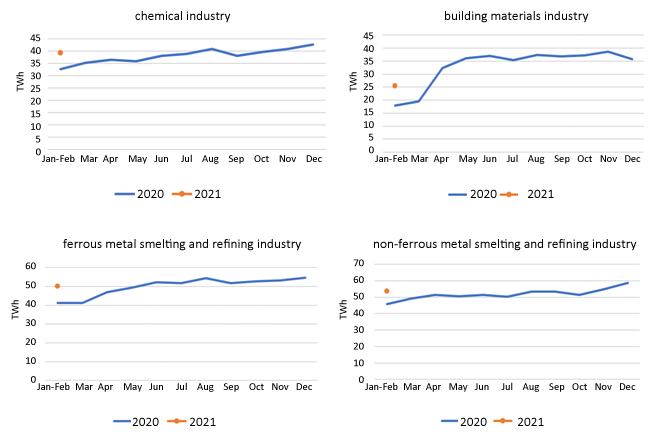
From January to February, the electricity consumption of the chemical industry was 79.0 TWh, an increase of 14.3% year-on-year, and the growth rate raised by 22.1 percentage points from the same period of the previous year. The electricity consumption of the building materials industry was 51.2 TWh, an increase of 39.4% year-on-year, and the growth rate increased by 57.8 percentage points from the same period of the previous year. The electricity consumption of the ferrous metal smelting and refining industry was 100.6 TWh, an increase of 18.8% year-on-year, and the growth rate was 21.6 percentage points higher than the same period of the previous year. The electricity consumption of the non-ferrous metal smelting and refining industry was 107.4 TWh, an increase of 12.7% year-on-year, and the growth rate was 13.9 percentage points higher than the same period of the previous year.
Tel:+86-25-84152563
Fax:+86-25-52146294
Email:export@hbtianrui.com
Address:Head Office: No.8 Chuangye Avenue, Economic Development Zone, Tianmen City, Hubei Province, China (Zip Code: 431700) Nanjing Office: Room 201-301, Building K10,15 Wanshou Road,Nanjing Area, China (Jiangsu) Pilot Free Trade Zone,Jiangsu Province,China (Zip Code:211899)